What is Driving Demand for Deeper Traffic Analysis?

search

During a customer review call last week, we got a very interesting quote from a US based user who offers marketing services to the retail sector: ‘We need greater insight over what is taking place on our internal network, systems, services, and external web farm seen through a single portal. We need to keep downtime to a minimum both internally and on our external customer-facing web farm. We chose LANGuardian because of its integration with SolarWinds and its deep-packet inspection capabilities.

Before discussing this in more detail, because of all the hype these days we also always ask about cloud now, so when we asked this contact about hosting these critical services in the cloud, he countered with 3 reasons for keeping them in house:

  1. Security
  2. Control
  3. Cost

When drilled on ‘cost’ he mentioned that they were shipping huge amounts of data and if hosting and storing this in the cloud, the bandwidth and storage related charges would be huge and did not make economic sense.

Back to Deeper Traffic Analysis, turns out this customer had already purchased and installed a NetFlow based product to try and get more visibility and try to focus on his critical server farm, his external/public facing environment. His business requires him to be proactive to keep downtime to a minimum and keep his customers happy. But, as they also mentioned to us: ‘With Netflow we almost get to the answer, and then sometimes we have to break out another tool like wireshark or something. Now with Netfort DPI (Deep Packet Inspection) we get the detail Netflow does NOT provide, true endpoint visibility.

What detail? What detail did this team use to justify the purchase of another monitoring product to management? I bet it was not a simple as ‘I need more detail and visibility into traffic, please sign this’! We know with tools like wireshark one can get down to a very low level of detail, down to the ‘bits and bytes’. But sometimes that is too low, far too much detail, overly complex for some people and very difficult to see the ‘wood from the trees’ and get the big picture.

One critical detail we in Netfort sometimes take for granted is the level of insight our DPI can enable into web or external traffic, does not matter if its via a CDN, or proxy or whatever, with deep packet inspection one can look deeper to get the detail required. Users can capture and keep every domain name, even URI and IP address AND critically the amount of data transferred, tie the IP address and URI to bandwidth. As a result, this particular customer is now able to monitor usage to every single resource or service they offer, who is accessing that URI or service or piece of data, when, how often, how much bandwidth the customer accessing that resource is consuming, etc.

Users can also trend this information to help detect unusual activity or help with capacity planning. This customer also mentioned that with deeper traffic analysis they were able to take a group of servers each week and really analyze usage, find the busiest server, least busy, top users, who were using up their bandwidth and what they were accessing. Get to the right level of detail, the evidence required to make informed decisions and plan.

CDN(Content Delivery Networks) usage has increased dramatically recently and are making life very difficult for network administrators trying to keep tabs and generate meaningful reports on bandwidth usage. We had a customer recently who powered up a bunch of servers and saw a huge peak in bandwidth consumption. With Netflow the domain reported was an obscure CDN and meant nothing. The LANGuardian reported huge downloads of data from windowsupdate.com from a particular IP address and also reported the user name.

What was that about justification? How about simply greater insight to reduce downtime, maximise utilisation, increase performance, reduce costs. All this means happier customers, less stress for the network guys and more money for everybody!

Thanks to NetFort for the article.

ThreatARMOR Reduces Your Network’s Attack Surface

ThreatARMOR Reduces Your Network’s Attack Surface

2014 saw the creation of more than 317 million new pieces of malware. That means an average of nearly one million new threats were released each day.

Here at Ixia we’ve been collecting and organizing threat intelligence data for years to help test the industry’s top network security products. Our Application and Threat Intelligence (ATI) research center maintains one of the most comprehensive lists of malware, botnets, and network incursions for exactly this purpose. We’ve had many requests to leverage that data in support of enterprise security, and this week you are seeing the first product that uses ATI to boost the performance of existing security systems. Ixia’s ThreatARMOR continuously taps into the ATI research center’s list of bad IP sources around the world and blocks them.

Ixia’s ThreatARMOR represents another innovation and an extension for the company’s Visibility Architecture, reducing the ever-increasing size of their global network attack surface.

A network attack surface is the sum of every access avenue an individual can use to gain access to an enterprise network. The expanding enterprise security perimeter must address new classes of attack, advancing breeds of hackers, and an evolving regulatory landscape.

“What’s killing security is not technology, it’s operations,” stated Jon Oltsik, ESG senior principal analyst and the founder of the firm’s cybersecurity service. “Companies are looking for ways to reduce their overall operations requirements and need easy to use, high performance solutions, like ThreatARMOR, to help them do that.”

Spending on IT security is poised to grow tenfold in ten years. Enterprise security tools inspect all traffic, including traffic that shouldn’t be on the network in the first place: traffic from known malicious IPs, hijacked IPs, and unassigned or unused IP space/addresses. These devices, while needed, create a more work than a security team could possible handle. False security attack positives consume an inordinate amount of time and resources: enterprises spend approximately 21,000 hours per year on average dealing with false positive cyber security alerts per a Ponemon Institute report published January 2015. You need to reduce the attack surface in order to only focus on the traffic that needs to be inspected.

“ThreatARMOR delivers a new level of visibility and security by blocking unwanted traffic before many of these unnecessary security events are ever generated. And its protection is always up to date thanks to our Application and Threat Intelligence (ATI) program.” said Dennis Cox, Chief Product Officer at Ixia.

“The ATI program develops the threat intelligence for ThreatARMOR and a detailed ‘Rap Sheet’ that provides proof of malicious activity for all blocked IP addresses, supported with on-screen evidence of the activity such as malware distribution or phishing, including date of the most recent confirmation and screen shots.”

ThreatARMOR: your new front line of defense!

Additional Resources:

ThreatARMOR

Thanks to Ixia for the article.

Customization Nation with Sapling Digital Clocks

Sapling Clocks 6 Digit Digital ClockNo matter the product, everyone has different tastes and styles they prefer. Because of this, people really enjoy the ability to customize the items they purchase to meet these preferences. Giving customers the option to personalize their product or service has benefited many different companies in many different industries.

Let’s take the shoe industry as an example. Nike has been wildly successful with the Nikeid option on their website. This option gives their patron the option to customize any type of shoe they want with any combination of colors. The car industry has also jumped on the customization bandwagon. Almost every major car company has an option on their website for their customers to customize the make, model, color, accessories and so much more.

The Sapling Company understands the importance of customization and as the manufacturer of synchronized time systems; Sapling has an array of options to satisfy the broadest of needs. We offer four different synchronized time system options, including: Wired, Wireless, Talkback, and IP. These systems include a master clock at the center of the network and multiple secondary clocks that display the accurate time. The master clock is updated with the accurate time from NTP of GPA, and then sends a signal to the secondary clocks. More specifically within a wireless clock system, the secondary clocks both receive and transmit the signal, until all of the clocks are properly updated.

Within the four systems is the option of what type of clock you would want: analog or digital. If you chose the round analog clocks, then you would get the option of the 12” or 16”clock. Sapling also offers a 9” or 12” square clock for more variety within the analog family. Both the round and square clocks have the additional options of customizable hands and dials!

If you chose the digital clocks, then you would be hit with the brand new color customization display options. While red is the standard color option, you will now have the choice between green, white, amber and blue.

Thanks to Sapling for the article.

The Network Design and Equipment Deployment Lifecycle

As we all know, technology has a life cycle of birth, early adoption, mainstream, and then obsoletion. Even the average consumer is very in touch with this lifecycle. However, within this overarching lifecycle there are “mini” lifecycles. One of these mini lifecycles that is particularly important to enterprises is the network design and equipment deployment lifecycle. This lifecycle is the basic roadmap of how equipment gets deployed within a company data network and key a topic of concern for IT personnel. While it’s its own lifecycle, it also aligns with the typical ITIL services of event management, incident management, IT operations management, and continual service improvement.

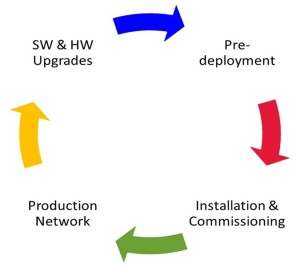
There are 5 primary stages to the network design and equipment deployment lifecycle: pre-deployment, installation and commissioning, assurance monitoring, troubleshooting, and decommissioning. I’ll disregard the decommissioning phase in this discussion as removing equipment is fairly straightforward. The other four phases are more interesting for the IT department.
The Network Design and Equipment Deployment LifecycleThe adjacent diagram shows a map of the four fundamental components within this lifecycle. The pre-deployment phase is typically concerned with lab verification of the equipment and/or point solution. During this phase, IT spends time and effort to ensure that the equipment/solution they are receiving will actually resolve the intended pain point.

During the installing and commissioning phase, the new equipment is installed, turned on, configured, connected to the network and validated to ensure that the equipment is functioning correctly. This is typically the least costly phase to find set-up problems. If those initial set-up problems are not caught and eliminated here, it is much harder and more costly to isolate those problems in the troubleshooting phase.

The assurance monitoring stage is the ongoing maintenance and administration phase. Equipment is monitored on an as-needed or routine basis (depending upon component criticality) to make sure that it’s functioning correctly. Just because alarms have not been triggered doesn’t mean the equipment is functioning optimally. Changes may have occurred in other equipment or the network that are propagating into other equipment downstream and causing problems. The assurance monitoring stage is often linked with proactive trend analysis, service level agreement validation, and quality of service inspections.

Troubleshooting is obviously the reactionary portion of the lifecycle devoted to fixing equipment and network problems so that the network can return to an optimized, steady state condition. Most IT personnel are extremely familiar with this stage as they battle equipment failures, security threats and network outages due to equipment problems and network programming changes.

Ixia understands this lifecycle well and it’s one of the reasons that it acquired Breaking Point and Anue Systems during 2012. We have capabilities to help the IT department in all four of the aspects of the network design and equipment deployment lifecycle. These tools and services are focused to directly attack key metrics for IT:

  • Decrease time-to-market for solutions to satisfy internal projects
  • Decrease mean-time-to-repair metrics
  • Decrease downtime metrics
  • Decrease security breach risks
  • Increase business competitiveness

The exact solution to achieve customer-desired results varies. Some simple examples include the following:

  • Using the NTO monitoring switch to give your monitoring tools the right information to gain the network visibility you need
  • Using the NTO simulator to test filtering and other changes before you deploy them on your network
  • Deploying the Ixia Storm product to assess your network security and also to simulate threats so that you can observe how your network will respond to security threats
  • Deploying various Ixia network testing tools (IxChariot, IxNetwork) to characterize the new equipment and network during the pre-deployment phase

Additional Resources:

Ixia Solutions

Network Monitoring

Related Products

Ixia Net Optics Network Taps Ixia Net Tool Optmizers
Ixia Network Tap
Ixia Net Optics network taps provide access for security and network management devices.
Net Tool Optimizers
Out-of-band traffic aggregation, filtering, dedup, load balancing

Thanks to Ixia for the article.

How to Deal With Unusual Traffic Detected Notifications

How to Deal With Unusual Traffic Detected NotificationsIf you get an unusual traffic detected notification from Google, it usually means your IP address was or still is sending suspicious network traffic. Google can detect this and has recently implemented security measures to protect against DDoS, other server attacks and SEO rank manipulation.

The key thing to remember is that the notification is based on your Internet facing IP address, not your private IP address which is assigned to your laptop\PC\device. If you don’t know what your Internet facing (or public) IP address is you can use something like this service.

Top tips for dealing with unusual traffic detected messages:

  1. Get an inventory. Do you have unknown devices on your network? There are many free applications which can do network scans. Another option is to deploy deep packet inspection tools which will passively detect what is running on your network.
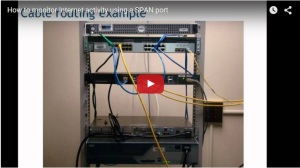
  2. Monitor traffic on your Internet gateway. Watch out for things like network scans, traffic on unusual port numbers, TOR traffic. I have included a video below which explains how you can do this.
  3. Track down the device using its MAC address. Network switches maintain a list of what MAC addresses are associated with what network switch ports. The guide at this link shows you how to do this on Cisco switches but similar commands are available on other switch models.
  4. See if your IP address is blacklisted. You can use something like this http://www.ipvoid.com/ to see if your IP address is known black lists.
  5. If you cannot find any issues, talk to your ISP. Maybe you need an IP change. IP addresses are recycled so it could be that you were allocated a dodgy one. This is a remote possibility so make sure you cover tips 1 to 4 first.

How to Monitor Internet Activity Using a SPAN Port

Further reading

In a previous blog post I also looked at how you can use LANGuardian to track down the source of unusual traffic on your network.

Blog Post: How to deal with “Google has detected unusual traffic from your network” notifications

Please don’t hesitate to get in contact with our support team if you are having an issue with a unusual traffic notification. They can help you quickly get to the root cause of issues associated with suspicious network traffic.

Thanks to NetFort for the article.

Key Factors in NCCM and CMDB Integration – Part 2 – Change Configuration and Backup

In Part 1 of this series I discussed how an NCCM solution and a CMDB can work together to create a more effective IT inventory system. In this post, I will be taking that a step further and show how your change configuration process will benefit from integration with that same CMDB.

Key Factors in NCCM and CMDB Integration - Part 2 – Change Configuration and BackupIn general, the process of implementing IT infrastructure change happens at 3 separate stages of an assets lifecycle.

  1. Initial deployment / provisioning
  2. In production / changes
  3. Decommissioning / removal

In each of these stages, there is a clear benefit to having the system(s) that are responsible for orchestrating the change be integrated with an asset inventory / CMDB tool. Let’s take a look at each one to see why.

1. Initial Deployment / Provisioning

When a new device is ready to be put onto the network, it must go through at least one (and probably many) pre-deployment steps in order to be configured for its eventual job in the IT system. From “out of the box” to “in production” requires at least the following:

  1. Installation / turn on/ pretest of HW
  2. Load / upgrade of SW images
  3. Configuration of “base” information like IP address / FQDN / Management configuration
  4. Creation / deployment of full configuration

This may also include policy security testing and potentially manual acceptance by an authorized manager. It is best practice to control this process through an ITIL compliant system using a software application which has knowledge of what is required at each step and controls the workflow and approval process. However, the CMDB / Service desk rarely if ever can also process the actual changes to the devices. This is typically a manual process or (in the best case) is automated with an NCCM system. So, in order to coordinate that flow of activity, it is absolutely essential to have the CMDB be the “keeper” of the process and then “activate” the NCCM solution when it is time to make the changes to the hardware. The NCCM system should then be able to inform the CMDB that the activity was performed and also report back any potential issues or errors that may have occurred.

2. In Production / Changes

Once a device has been placed into production, at some point there will come a time where the device needs to have changes made to its hardware, software or configuration. Once again, the change control process should be managed through the CMDB / service desk. It is critical that as this process begins, the CMDB has been kept up today as to the current asset information. That way there are no “surprises” when it comes time to implement the changes. This goes back to having a standard re-discovery process which is performed on a known schedule by the NCCM system. We have found that most networks require a full rediscovery about 1x per week to be kept up to date –but we have also worked with clients that adjust this frequency up or down as necessary.

Just as in the initial deployment stage, it is the job of the NCCM system to inform the CMDB as to the state of the configuration job including any problems that might have been encountered. In some cases it is prudent to have the NCCM system automatically retry any failed job at least once prior to reporting the failure.

3. Decommissioning / Removal

When the time has come for a device to be removed from production and/or decommissioned the same type of process should be followed from when it was initially provisioned (but in reverse). If the device is being replaced by a newer system then the part of (or potentially the whole) configuration may just be moved to the new hardware. This is where the NCCM systems backup process will come into play. As per all NCCM best practices, there should be a regular schedule of backups that happen in order to make sure the configuration is known and accessible in case of emergency etc.

Once the device has been physically removed from the network, it must also either be fully removed from the CMDB or at the very least should be tagged as decommissioned. This has many benefits including stopping the accidental purchase of support and maintenance on a device which is no longer in service as well as preventing the NCCM system from attempting to perform discovery or configuration jobs on the device in the future (which would create a failure etc).

NCCM systems and CMDB’s really work hand in hand to help manage the complete lifecycle of an IT asset. While it could be possible to accurately maintain two non-connected systems, the time and effort involved, not to mention that much greater potential for error, makes the integration of your CMDB and NCCM tools a virtual necessity for large modern IT networks.

Top 20 Best Practices for NCCM
Thanks to NMSaaS for the article.

Infosim® Announces Release of StableNet® 7.5

Infosim StableNet Network Monitoring SoftwareInfosim®, the technology leader in automated Service Fulfillment and Service Assurance solutions, today announced the release of version 7.5 of its award-winning software suite StableNet® for Telco and Enterprise customers.

StableNet® 7.5 provides a significant number of powerful new features, including:

  • Dynamic Rule Generation (DRG); a new and revolutionary Fault Management concept
  • REST interface supporting the new StableNet® iPhone (and upcoming Android) app
  • Highly customizable dashboard in both the GUI and Web Portal
  • Enabling integration with SDN/NFV element managers
  • NCCM structurer enabling creation of optimized and well-formatted device configurations
  • New High-Availability (HA) infrastructure based on Linux HA technology
  • Syslog & Trap Forwarding enabling integration of legacy systems that rely on their original trap & syslog data
  • Open Alarms GeoMap enabling geographical representation of open alarms

StableNet® version 7.5 is available for purchase now. Customers with current maintenance contracts may upgrade free of charge as per the terms and conditions of their contract.

Supporting Quotes:

Jim Duster, CEO Infosim® ,Inc.

“We are happy that our newest release is again full of innovative features like DRG. Our customers are stating this new DRG feature will help them receive a faster ROI by improving automation in their fault management area and dramatically increase the speed of Root-Cause Analysis.”

Download the release notes here

Thanks to Infosim for the article.

How Testing Solutions Reduce Risk & Improve Customer Satisfaction

How Testing Solutions Reduce Risk & Improve Customer SatisfactionImagine you’re trying to book a flight. You call the toll-free number and use the interactive voice response (IVR) to get through to bookings, but instead you are put through to the baggage area. You hang up and try again, but this time you wind up speaking to the airline lounge. Do you try a third time or call a competitor? I know what I would do.

The IVR is now a key component to delivering a great customer experience, so what steps should a business take to ensure these systems are working optimally? Do they take proactive measures, or just wait until a customer lets them know that something is broken? And, by the time it gets to this stage, how many customers may have been lost?

There are some businesses out there taking unnecessary risks when it comes to testing the reliability of their communications systems. Instead of performing extensive tests, they’re leaving it up to their customers to find any problems. Put bluntly, they’re rolling the dice by deciding to deploy systems that haven’t been properly tested. This is the primary line of communication with their customers and, in many cases, it’s also how they generate significant revenue, why would they put both customer satisfaction and revenue in jeopardy?

Businesses have quite a few useful options when it comes to proactive testing. We recently acquired IQ Services, a company that tests these environments on a scheduled basis to make sure they’re working properly. It’s an automated process that tests how long it takes to answer, makes sure that the correct responses are given, and even performs a massive stress test with up to 80,000 concurrent calls. (It’s very useful for scenarios such as a large healthcare provider going through open enrollment.) These testing solutions are the way that businesses can ensure that their systems are working reliably under heavy load without leaving anything to chance.

In a world where we think of people as risk-averse, it’s interesting to observe anyone who chooses not to perform these tests. It’s not necessarily a conscious decision if the situation were actually framed in a way where someone knew exactly what they were putting at risk, they’d probably make a better choice. You wouldn’t buy car insurance after you already had an accident. It simply wouldn’t do you much good at that point. The same thing applies to your communications systems. It only makes sense to take a proactive approach to make sure things are working as expected.

Now that you’re aware of what’s at risk if you don’t perform these important tests, don’t make the conscious decision to wait until something has already gone wrong. We’re talking about the potential loss of millions of dollars per hour (or even per minute in certain cases). Some strategic planning can give you the peace of mind you’ll avoid catastrophic loss of revenue in the future. Whenever you do go live with a new feature, you can do so with confidence.

We’ve brought these new Testing Solutions into the Prognosis family. Above and beyond, we want to make sure people understand these capabilities are available. You don’t have to be reactionary, there are proactive solutions to stop you from rolling the dice when it comes to your business and customers. Don’t leave the livelihood of your organization to chance. Of course, if you’re in the mood to gamble your money, there’s always Vegas.

Thanks to IR Prognosis for the article.

Infosim® Global Webinar Day October 29th, 2015 StableNet® 7.5 – What’s New?

Infosim® Global Webinar Day October 29th, 2015 StableNet® 7.5 - What's New?

Join Harald Hoehn, Senior Developer and Consultant with Infosim®, for a Webinar and Live Demo on the latest information regarding StableNet® 7.5

This Webinar will provide insight into:

StableNet® 7.5 New Features such as:

  • New Web Portal [Live Demo]
  • New Alarm Dashboard [Live Demo]
  • New NCCM Structurer [Live Demo]
  • DRG (Dynamic Rule Generation) as a new and revolutionary Fault Management concept

StableNet® 7.5 Enhancements such as:

  • Enhanced Weather Maps [Live Demo]
  • Improved Trap- and Syslog-Forwarding [Live Demo]
  • Advanced Netflow Features [Live Demo]
  • Enhanced Support for SDN

But wait – there is more! We are giving away three Amazon Gift Cards (value $50) on this Global Webinar Day. To join the draw, simply answer the trivia question that will be part of the questionnaire at the end of the Webinar. Good Luck!

Infosim® Global Webinar Day October 29th, 2015 StableNet® 7.5 - What's New?
(Take a look at our previous Webinars here.)

Thanks to Infosim for the article.

How Can We Monitor Traffic Associated with Remote Sites?

How Can we Monitor Traffic Associated with Remote Sites?Many IT teams are now tasked with managing remote sites without having the luxury of local IT support. Business owners expect everything to be done remotely, we do live in the connected age, don’t we? Is it possible to see what is happening in these networks without the need for installing client or agent software everywhere?

You can gather some network performance information using SNMP or WMI but you will be limited to alerts or high level information. What you need is some form of deeper traffic analysis. Software applications that do traffic analysis are ideal for troubleshooting LAN and link problems associated with remote sites.

There are two main technologies available to analyze network traffic associated with remote sites, those that do flow analysis and those that capture network packets. Flow statistics are typically available from devices that can route data between two networks, most Cisco routers support NetFlow for example. If your remote networks are flat (single subnet) or you don’t have flow options on your network switches then packet capture is a viable option.

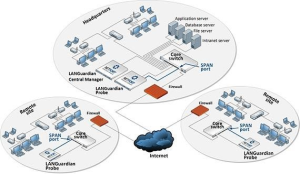
You can implement packet capture by connecting a traffic analysis system to a SPAN or mirror port on a network switch at your remote site. You can then log onto your traffic analysis system remotely to see what is happening within these networks.

How Can we Monitor Traffic Associated with Remote Sites?

NetFort LANGuardian has multiple means of capturing data associated with remote sites. The most popular option is to install an instance of the LANGuardian software at your HQ. Sensors can be deployed on physical or virtual platforms at important remote sites. Data from these is stored centrally to you get a single reference point for all traffic and security information across local and remote networks.

LANGuardian can also capture flow based statistics such as NetFlow, IPFix and SFlow, routers/switches on the remote sites can be configured to send flow traffic to LANGuardian. Watch out for issues associated with NetFlow as it has limitations when it comes to monitoring cloud computing applications.

Download White Paper

How to monitor WAN connections with NetFort LANGuardian

Download this whitepaper which explains in detail how you can monitor WAN connections with NetFort LANGuardian

How Can we Monitor Traffic Associated with Remote Sites?

How To Find Bandwidth Hogs

Thanks to NetFort for the article.